Fanger’s model
Fanger’s model
– Jaco Heinen, 04/07/19
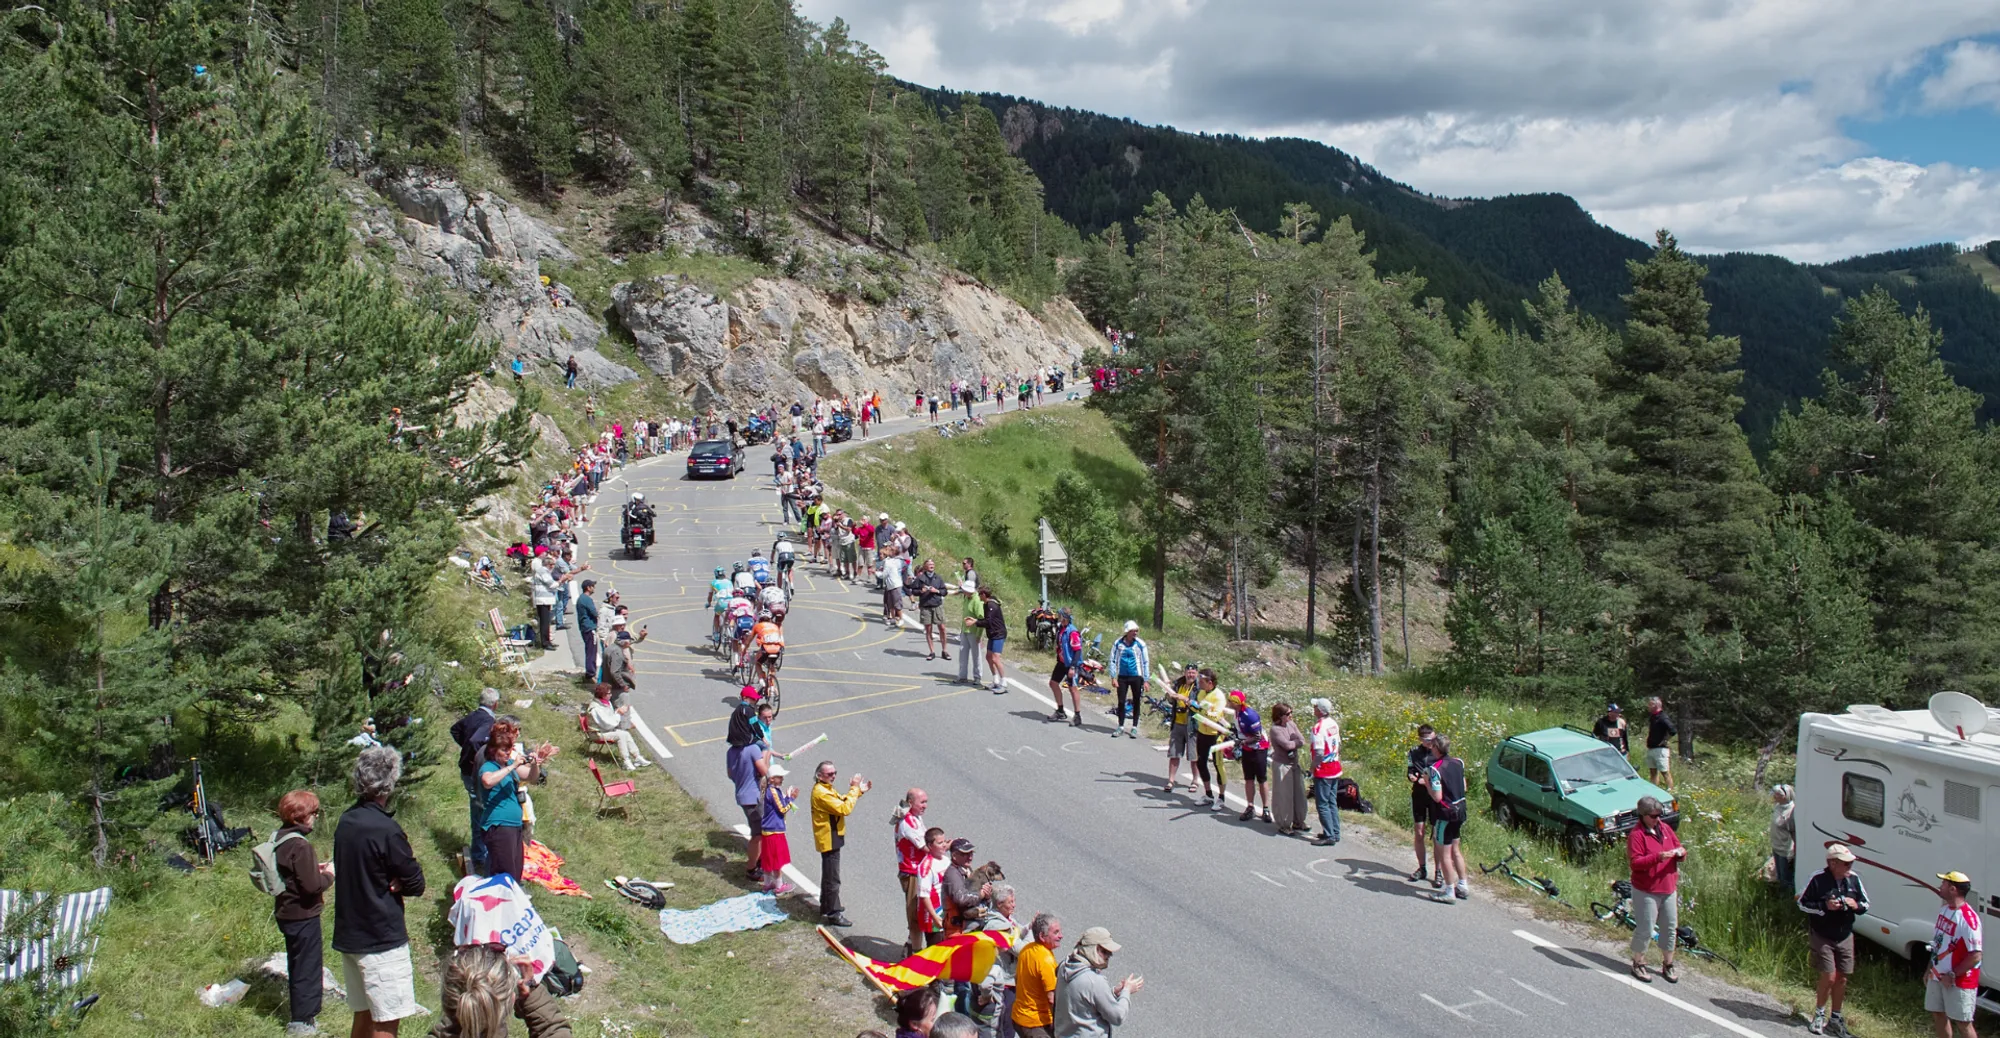
A cycling pro is making his way up to a mountain top. The temperature is 10°C and dropping. He doesn’t care. Sweat drips from his forehead and nose as the track gets steeper: the incline is almost 10% right now. An excited crowd stands next to the road. A person runs alongside him up the road for a few metres. As the cyclist reaches the top, someone hands him a newspaper which he puts under his shirt. He starts the five-kilometre descent toward the finish. How well will he do?
Thermal comfort
The man cycling up the mountain is Adam Yates at the end of the 16th stage of last year’s Tour the France, which started in Carcassonne and ended in Bagnères-de Luchon. The temperature on the mountaintop is seven degrees Celsius, and the crowd next to the road is wearing jackets and long trousers. Although Adam has nothing but a thin cycling shirt and tights on, he has sweat dripping off him. What causes this difference in perceived temperature and thermal comfort?
A range of factors
As you know, people get hotter when they take part in intense physical activity. There’s a big difference between standing still and cycling up a slope with a 10% incline. Then there is clothing: the more clothes one wears and the thicker they are, the hotter one feels. Clothing and physical activity together determine thermal comfort at a given time.
Of course, the actual outside temperature matters very much as well. Take the mountain on that day during the Tour de France: it was chilly and cloudy – but what if the sun had broken through the clouds? The sun’s radiation would have warmed up the crowd.
Adam placed a newspaper under his shirt for protection against the cold despite the fact that he was about to start his descent and the surrounding temperature would rise – because he knew that the air whizzing around him as he rode down would cool him down. When we are stationary and the air moves around us, we call this draught.
The PMV
A person’s thermal comfort depends both on the surrounding conditions, like temperature and humidity, and their level of physical activity & the clothes they’re wearing. Povl Ole Fanger, a prominent researcher in the field of thermal comfort, constructed a model for rating the level of comfort called the PMV (predicted mean vote). It has the following values:
Cold -3
Cool -2 High muscle activity – shivering
Slightly cold -1 Vasoconstriction – narrowing of blood vessels
Neutral 0
Slightly warm 1 Vasodilation – widening of blood vessels
Warm 2 Perspiration
Hot 3
You can’t make everyone happy
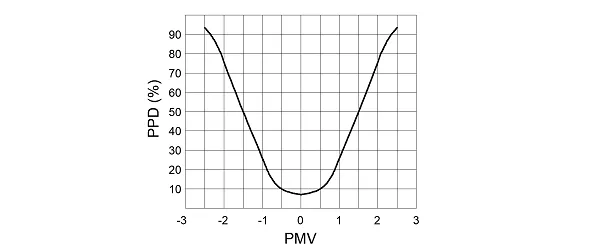
In this model, Fanger used all the above-mentioned variables as input. This makes it possible to predict how comfortable someone might feel if, for example, they are cycling, the surrounding temperature is seven degrees Celsius, there is no radiation, the air speed is two metres per second, relative humidity is 45% and they are wearing light clothing. Of course, not everyone perceives temperature the same way. Adam is a trained athlete who eats healthy and sleeps well. He doesn’t consider a PMV of 1.1 to be uncomfortable. But someone else might. This is why the Y-axis of Fanger’s model is called the predicted percentage dissatisfied (PPD).

Fanger’s model
As you can see, it’s impossible to ensure that everyone is satisfied. Even when the PMV is exactly zero, there still is a PPD of seven per cent. A person could be sick or sleep-deprived: these are all factors which have an impact on perceived thermal comfort.
And what about Adam Yates? Did he win the stage with only five kilometres to go in the descent? No: he crashed. Julian Alaphilipe won the stage. Now that’s a whole other kind of dissatisfaction!
Jaco Heinen | Service & Maintenance Manager
Jaco Heinen has been working at Heinen & Hopman for over eight years. He became the Service & Maintenance manager four years ago and manages the service contracts for maritime HVAC installations worldwide.